
Fig 3. The effect of intraperitoneal administered anti-α-Syn antibodies on AAV vector mediated α-Syn expression.
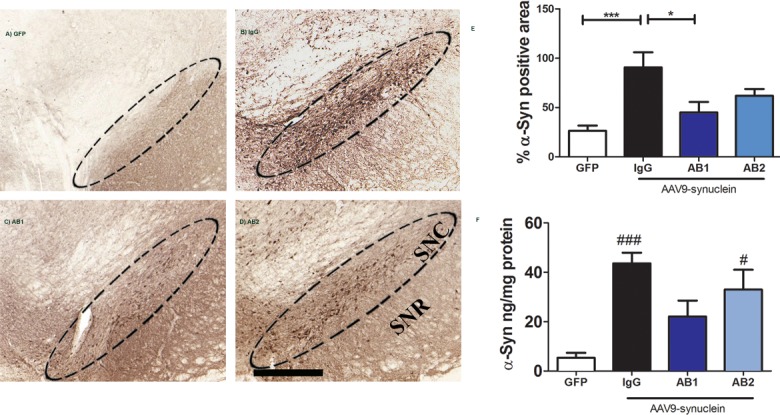
Immunostaining of the SN region with an antibody against α-Syn. Administration of AAV-α-Syn into the rat SN caused significant expression of α-Syn in the SN (B) compared to the AAV-GFP control group (A). Intraperitoneal injection of anti-α-Syn antibody AB1 reduced α-Syn level in the SN (C), while injection with antibody AB2 had a reduced effect (D). Quantitative analysis of levels of α-Syn expression is presented as percent positive area (E). Data are presented as the percent positive area of anti-α-Syn staining throughout the SN (n = 8 animals per group). Asterisk denotes significance (*** P<0.001, * P<0.05) with comparison made to the ipsilateral AAV-GFP group by 1-way ANOVA with post-hoc Bonferroni test. ELISA analysis confirmed a significant reduction in α-Syn levels in the SN with antibody AB1 compared to IgG treatment (F). ### P< 0.001, # P< 0.05 vs. Control AAV-α-Syn + IgG. Data are presented as the mean concentration of α-Syn in pg/μg of protein ± SEM (n = 6 per group). Scale bars are 100μm.