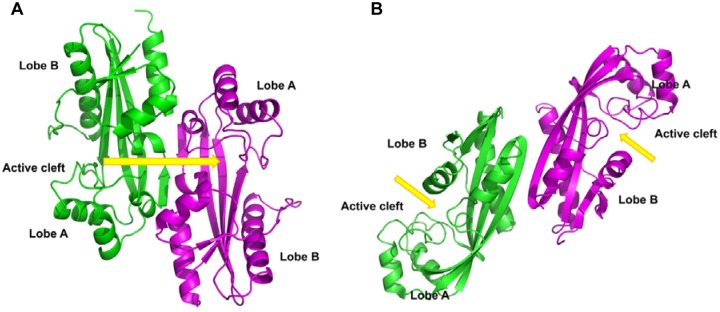
Fig 3. Comparison of YhdE_E33A and Maf dimers.

(A) The YhdE_E33A dimer. (B) The Maf dimer. The ribbon diagrams of two monomers are in green and magenta. The active sites are marked by yellow arrows. These figures were made using PyMOL.

(A) The YhdE_E33A dimer. (B) The Maf dimer. The ribbon diagrams of two monomers are in green and magenta. The active sites are marked by yellow arrows. These figures were made using PyMOL.