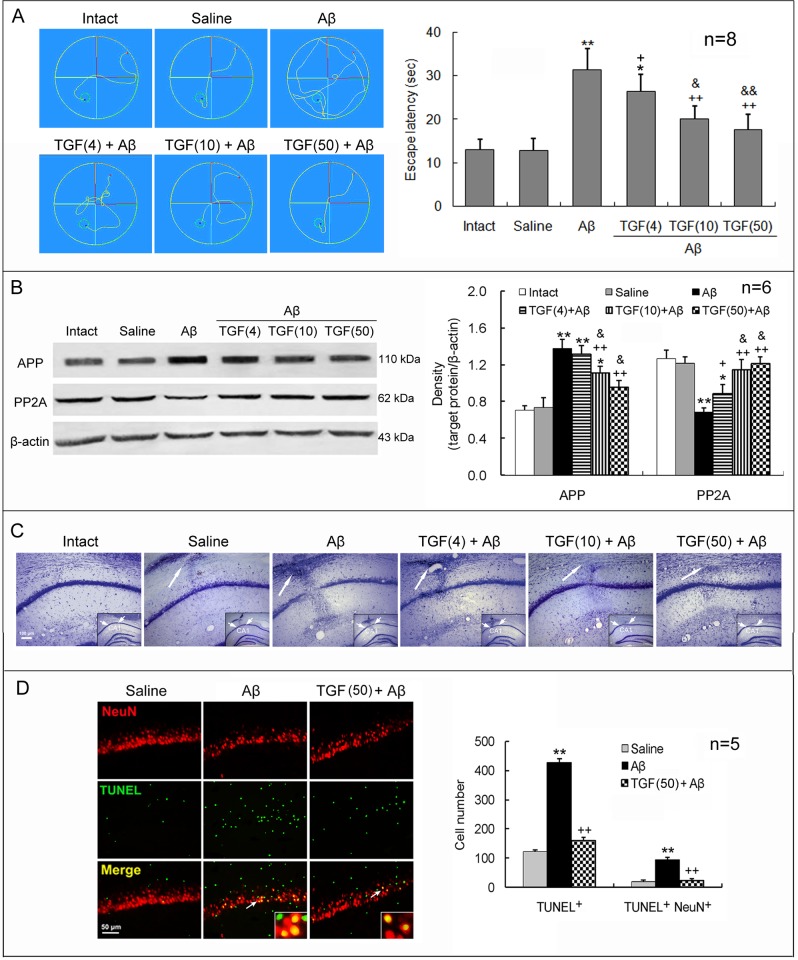
Figure 1. ICV TGF-β1 pretreatment prevents Aβ1–42-induced cognitive impairment and neuronal loss and apoptosis.
TGF-β1 (4, 10 or 50 ng in 5 μl) was given ICV one hour prior to bilateral hippocampal Aβ1–42 injection in rats. On day 7 following TGF-β1 administration, behavioral and neuronal changes were measured. (A) Escape latency in Morris water maze. Left panel exhibits swimming tracks of rats in Morris water maze. The escape latency was recorded from the time the rats entered the water (the red points) until their arrival on the platform (the green small rounds). Right panel is a statistical histogram for these experiments. (B) Expression levels of APP and PP2A in the hippocampus. Left panel shows representative electrophoretic bands, and right panel indicates graphical results of repeated experiments. (C) Nissl stain of hippocampal CA1 region of rats. The big arrows point to locations where injection needles were placed and reactive gliosis is seen. Note that Aβ1–42 induced an obvious neuron loss in the CA1 region and that TGF-β1 reduced this loss, reflected by the density of cells with Nissl bodies. The insets within the images are general views of the hippocampus, in which the CA1 region is denoted. (D) Immunofluorescent histochemistry for NeuN and TUNEL in the hippocampus. Left panel is a representative image. The arrows point to the NeuN/TUNEL double-stained cells, which are magnified in the insets. Right panel is a statistical histogram of the repeated experiments. For each rat, a total of 15 visual fields in three hippocampal sections was counted for the TUNEL-positive cells. Aβ = Aβ1–42; TGF(4) = 4 ng of TGF-β1; TGF(10) = 10 ng of TGF-β1; TGF(50) = 50 ng of TGF-β1. *p<0.05, **p<0.01, versus intact or saline-treated rats; +p<0.05, ++p<0.01, versus alone Aβ1–42-injected rats; &p<0.05, &&p<0.01, versus 4 or 10 ng of TGF-β1 administered rats.

