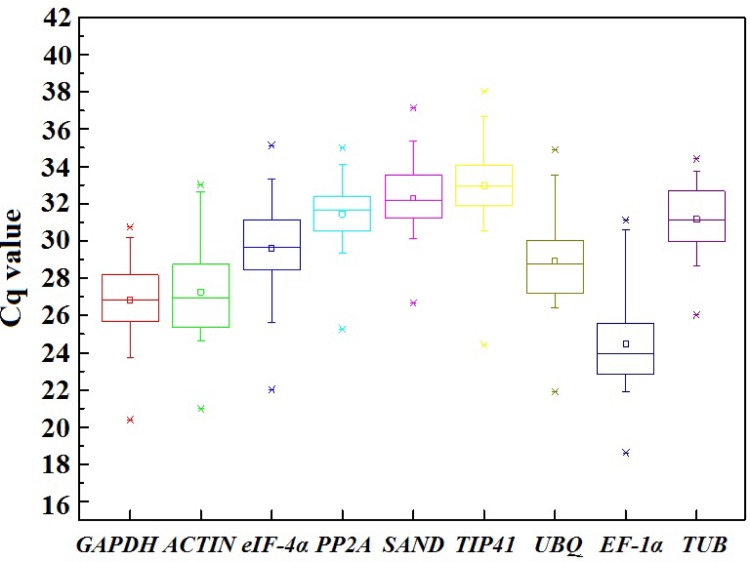
Fig 1. Cq values of candidate reference genes in all carrot samples.
Asterisks denote outliers. The line across the box depicts the median value. The inside box depicts Cq values. The outside box’s bottom line is determined by the 25th percentile, whereas the top line is determined by the 75th percentile. The top and bottom whiskers are determined by the 5th and 95th percentiles, respectively.

