
Fig. 3.
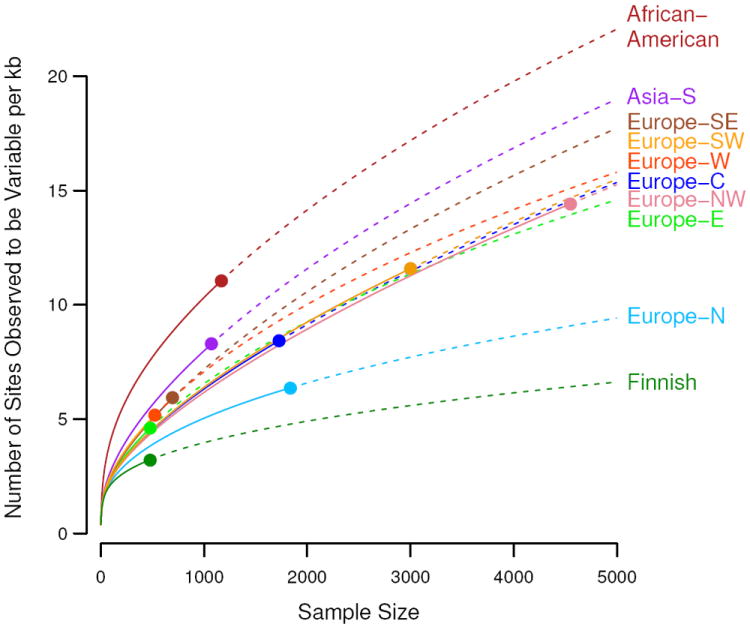
Number of variants per kilobase of sequence with sample sizes increasing to 5,000 people for multiple populations. Observed numbers are given as a dot, solid and dashed lines indicate hyper-geometric expectations and jack-knife projections, respectively.