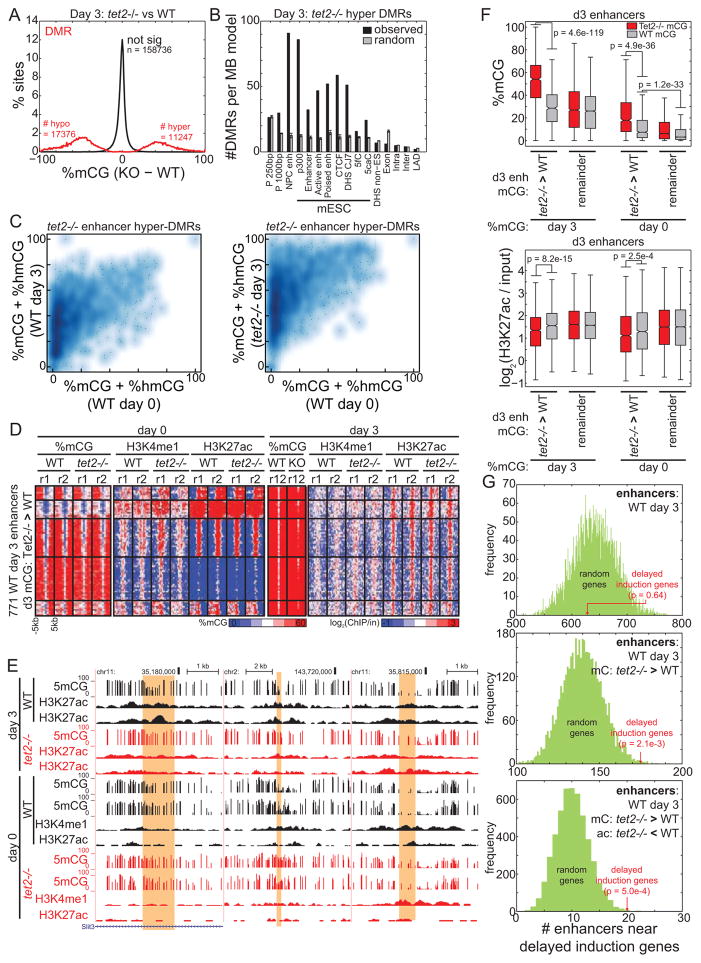
Figure 6. Differential enhancer methylation contributes to delayed gene induction.
(A) Distribution of change in 5mC for DMRs identified in Tet2−/− cells compared to WT cells 3 days after mESC differentiation towards NPCs. (B) Relative enrichment of Tet2−/− hyper DMRs from (A) (black) and random sites (gray) at genomic elements, normalized to the total coverage of the element type. Error bars indicate standard deviation. (C) Density heatmap representing the methylation state of hypermethylated enhancers before (x axis) and after (y axis) differentiation in WT (left) and Tet2−/− (right) cells. (D) Heatmap representing the epigenetic state of d3 Tet2−/− hypermethylated enhancers. (E) Genome browser snapshots of DNA methylation and chromatin state at d3 Tet2−/− hypermethylated enhancers (yellow). (F) Boxplots quantifying mCG (top) and quantile-normalized H3K27ac (bottom) at enhancers before (right) and after (left) differentiation. Day 3 Tet2−/− specific hypermethylated enhancers are labeled as “Tet2−/− > WT”, and other active enhancers as “remainder”. Boxplot edges indicate the 25th and 75th percentiles, and whiskers indicate non-outlier extremes. (G) The number of enhancers within TADs containing delayed induction genes is indicated in red, compared to the distribution of 5000 random gene sets. Enhancers are defined as: (top) the set of all WT day 3 active enhancers, (middle) the subset that is hypermethylated in Tet2−/− cells at day 3, and (bottom) the subset with WT specific H3K27ac at day 3.

