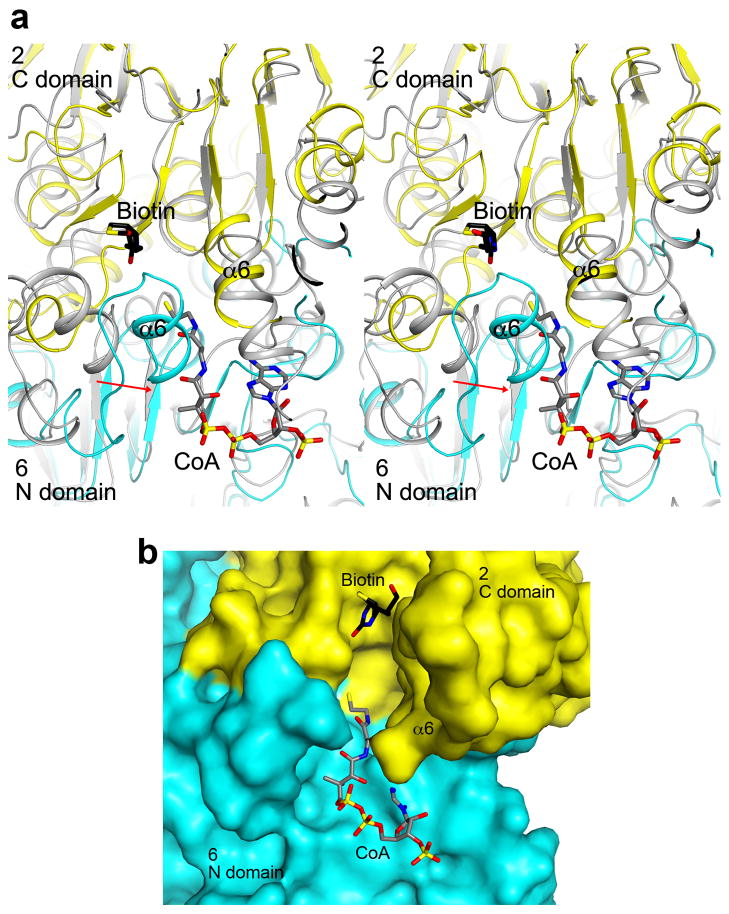
Extended Data Fig. 6.
The CT active site of LCC. (a). Stereo drawing of the overlay of the CT active site (cyan and yellow) of MapLCC with that of PCC (gray)47. The model of CoA was obtained from the structure of the complex with yeast ACC CT domain48. The α6 helix in the N domain of monomer 6 shows a more closed conformation (indicated with the red arrow), and clashes with the CoA model. There is also a clash with the adenine base of CoA. There may be a conformational change in this region of MapLCC for CoA binding. (b). Molecular surface of the CT active site region of MapLCC. The α6 helix in the N domain of monomer 6 was removed for a clearer view of the active site.

