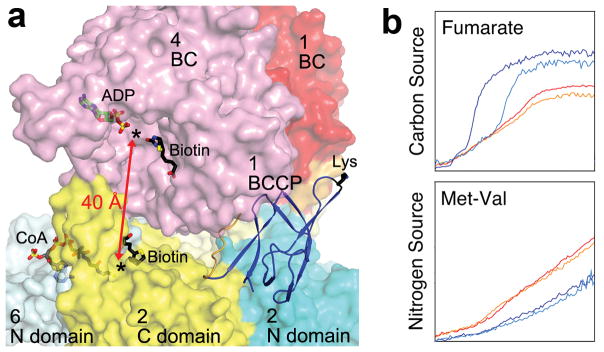
Figure 4.

Catalysis and function of MapLCC. (a). The BC and CT active sites (black asterisks) of MapLCC are separated by ~40 Å (red arrow). Molecular surface of MapLCC is shown, colored as in Fig. 1c. The domains are labeled by the monomer they belong to. The Lys side chain of BCCP to which biotin would be connected to is shown in black. The binding modes of ADP (green) and biotin (black) to E. coli BC subunit are shown as stick models 20. The binding mode of CoA (gray) to the CT domain of yeast ACC 29 and biotin (black) in the β (CT) subunit of PCC 10 are also shown. (b). Phenotypic differences between wild-type and LCC knockout (ΔPA14_46320) P. aeruginosa strains, revealed by a colorimetric assay that monitors reduction of a tetrazolium dye. Assays were carried out twice in each medium for the wild-type (red and orange) and mutant (blue and cyan) strains. For each panel, the horizontal axis is time (24 hrs), and the vertical axis is OmniLog signal 27.
