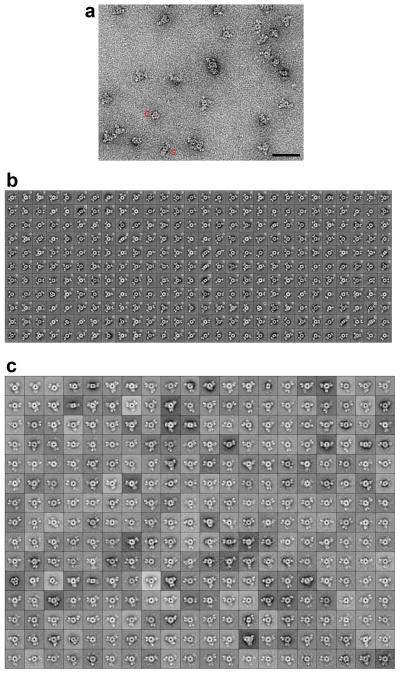
Extended Data Fig. 5.
Electron microscopy studies of LCC. (a). Representative raw image of negatively stained MapLCC. “S” marks a side view of the holoenzyme, and “C” indicates a contaminant. Scale bar: 500 Å. (b). The 308 class averages of negatively stained MapLCC obtained from 19 generations of the iterative stable alignment and clustering (ISAC) procedure49 implemented in SPARX50. These class averages represent 65% (15,932 particles) of the entire data set (24,535 particles). Averages representing side views are marked with a “S”, averages that were used to create Supplementary Video S1 are marked with a “*”, and averages that represent a contaminant are marked with “C”. The side length of the individual panels is 340 Å. (c). The averages obtained by classifying all 24,535 particles of negatively stained MapLCC into 300 classes using K-means classification in SPIDER51. Averages are shown in rows with the most populous class at the top left and the least populous class at the bottom right. The side length of the individual panels is 340 Å.

