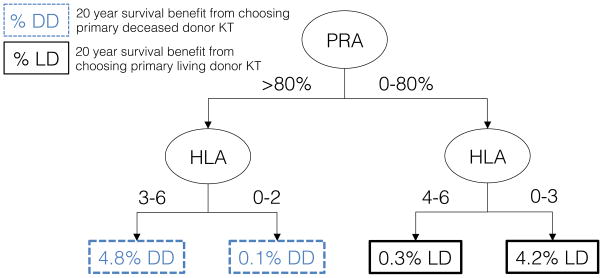
Figure 3. Classification and regression tree (CART) analysis: patient and donor characteristics that are most predictive of 20-year survival benefit from undergoing primary living donor versus deceased donor KT.
CART data from 336 hypothetical donor phenotypes and 81,920 hypothetical candidate phenotypes. Tree pruned to 2 levels to avoid overfitting. Donor characteristics included age, gender, race, HLA mismatches, and smoking history. Patient characteristics include age, gender, race, previous dialysis, previous KT, etiology of renal disease (FSGS, other glomerular disease, CAKUT, or other), PRA, ABO, and estimated times to deceased donor KT. To navigate the tree, start at the “PRA” node; if the candidate has PRA greater than 80% move left down the tree.

