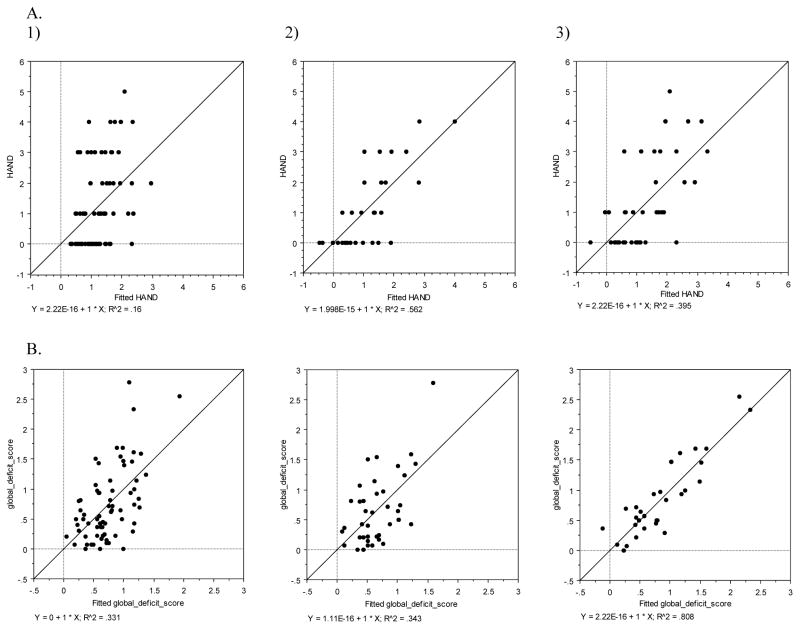
Fig. II. Multiple Regression Plots.
A) HAND relative to the output of three stepwise regressions (fitted HAND) for 1) all patients, 2) the young cohort, and 3) the old cohort being examined. B). Global deficit score relative to the output of three stepwise regressions (fitted global deficit score) for 1) all patients, 2) the young cohort, and 3) the old cohort being examined.

