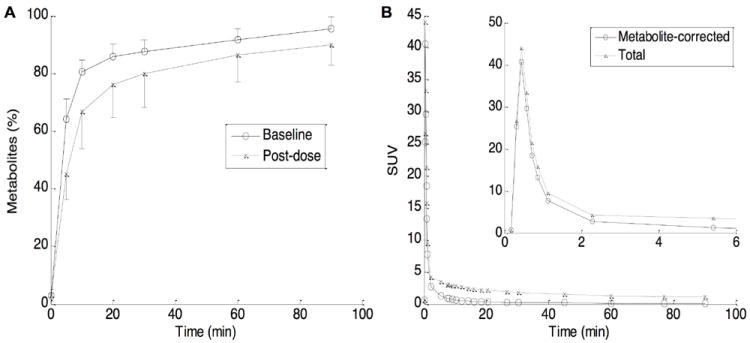
Fig. 1.

Time profiles of total radioactive metabolites in plasma (mean and SD bars) given by HPLC analysis, separately for baseline and post-Fenobam scans (panel A). Total and metabolite-corrected time-activity curves (TACs) in plasma, mean of 4 baseline scans (panel B). The inset shows TACs for early time points.
