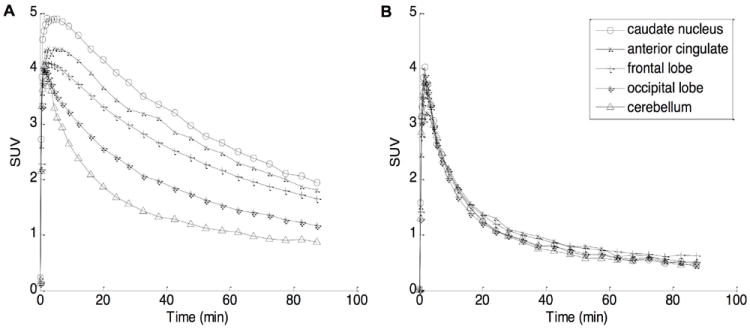
Fig. 3.

Time-activity curves (TACs) of selected brain regions following a bolus injection of [11C]ABP688, average of 4 baseline scans (panel A) and one post-fenobam scan with 1.33 mg/kg dose (B), expressed in standardized uptake value (SUV) in percentage.
