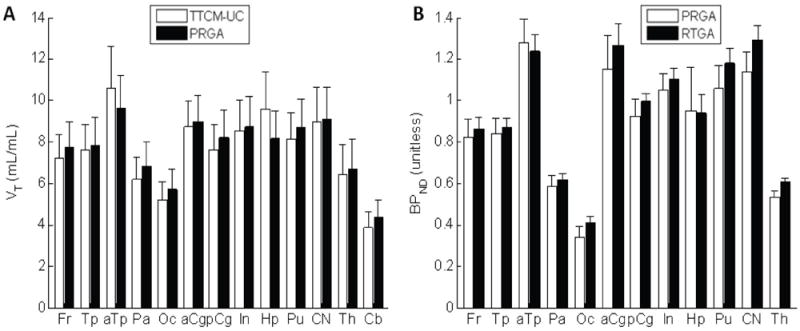
Fig. 4.

Histograms showing regional values of VT given by an unconstrained two-tissue compartmental model (TTCM-UM) and the plasma reference graphical analysis (PRGA) (panel A), and regional values of BPND given by PRGA and the reference tissue graphical analysis (RTGA) (panel B). Regions are frontal (Fr), temporal (Tp), parietal (Pa), and occipital (Oc) lobes, anterior (aCg) and posterior (pCg) cingulate cortices, insula (In), hippocampus (Hp), putamen (Pu), caudate nucleus (CN), thalamus (Th), and cerebellum (Cb).
