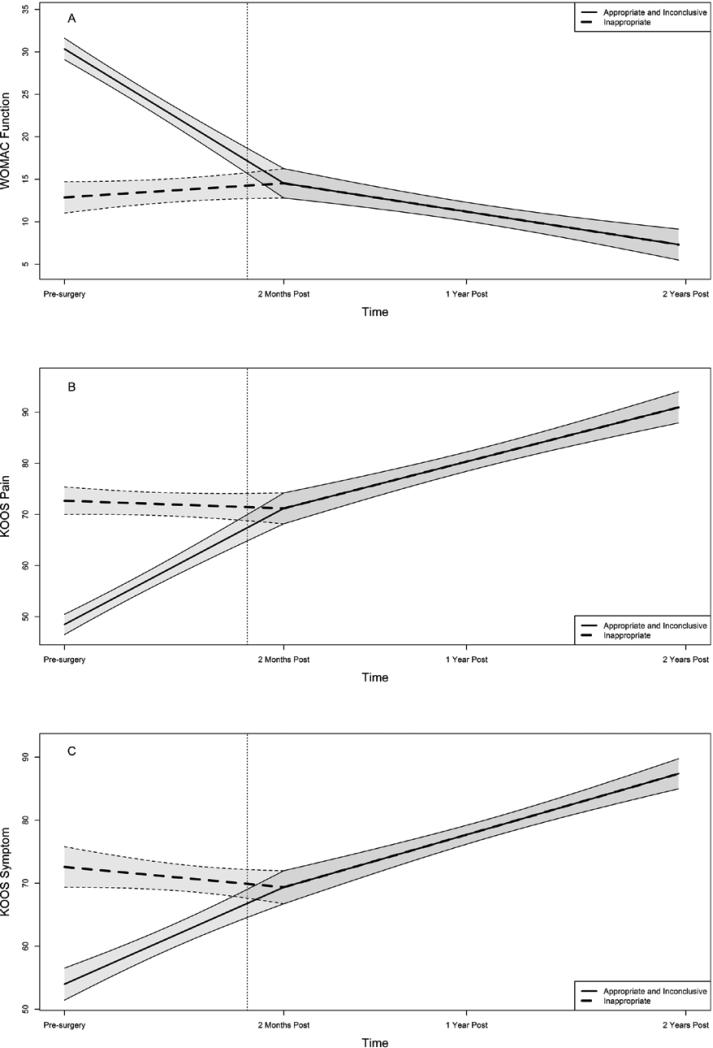
Figure 2.
The figure illustrates the early perioperative and later postoperative outcome trajectories for the WOMAC Function scale (Panel A), the KOOS Pain scale (Panel B), and the KOOS Symptoms scale (Panel C). The data were obtained pre-operatively and yearly over a two-year post-operative period. The heavy solid line represents the combined data for the appropriate and inconclusive groups while the heavy dashed line represents data from the inappropriate group. The thinner lines bounding each heavy line represent the 90% confidence intervals for the two sets of data and the dotted vertical line indicates the time of surgery. The WOMAC Physical Function score ranges from 0 to 68 with higher scores equating to worse function. The KOOS Symptoms and Pain scales range from 0 to 100 with higher scores equating to less symptoms and less pain.

