Fig.6.
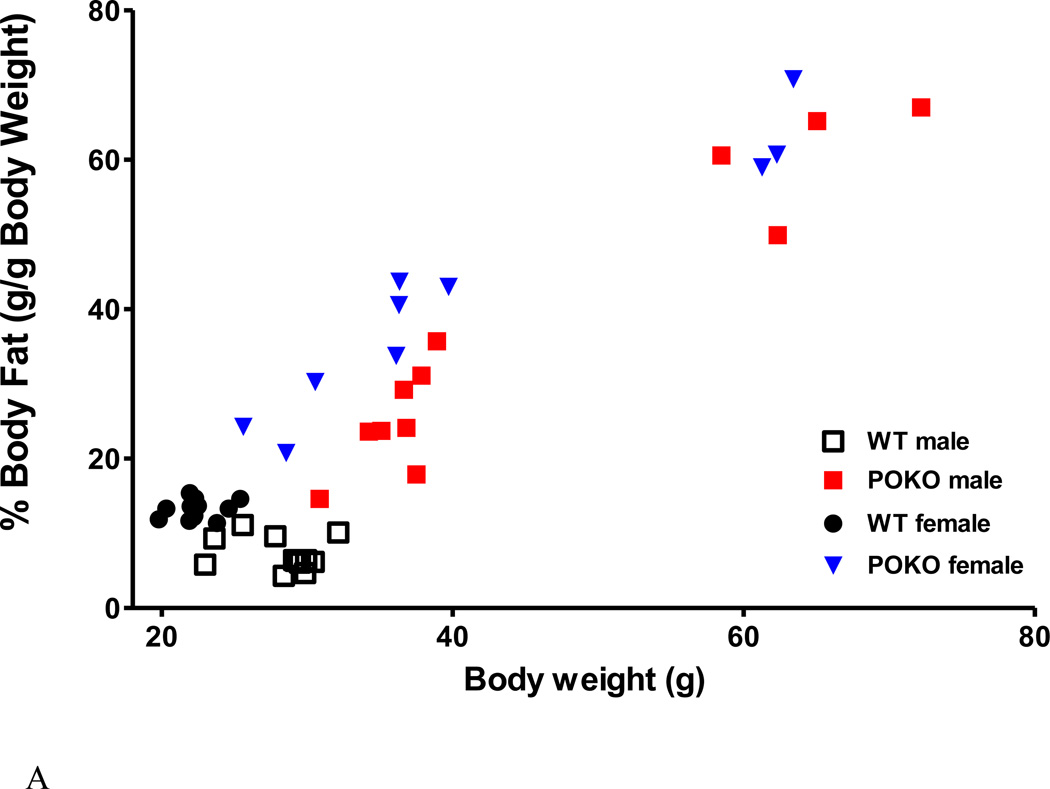
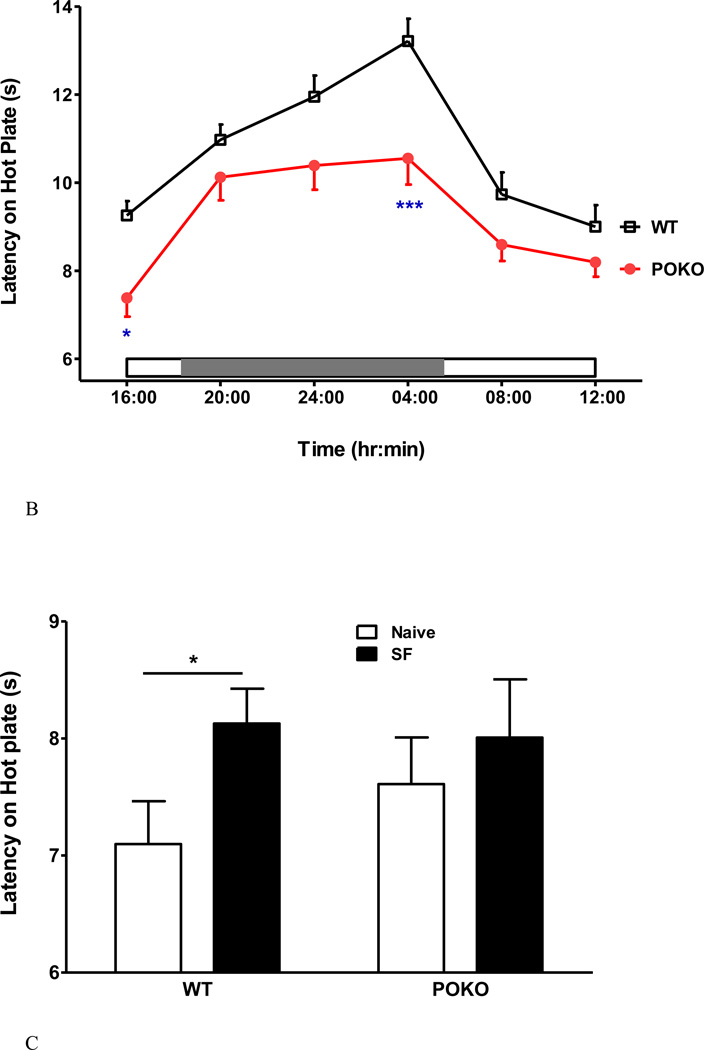
Metabolic phenotype and neurobehavioral performance of POKO mice. (A) There was a correlation of percent of body fat and body weight of the POKO and WT mice at age of 22–25 weeks. POKO mice had higher adiposity than WT mice (p < 0.0001). (B) POKO mice showed reduced circadian amplitude of thermal pain latency, with significant decrease at 4 pm and 4 am. (C) Potential interactions of SF and obesity were determined in 4 groups of mice. SF had a trend toward increased pain threshold (p = 0.07) by 2-way ANOVA. SF increased pain threshold in the WT mice, whereas the POKO mice did not show a significant change.


