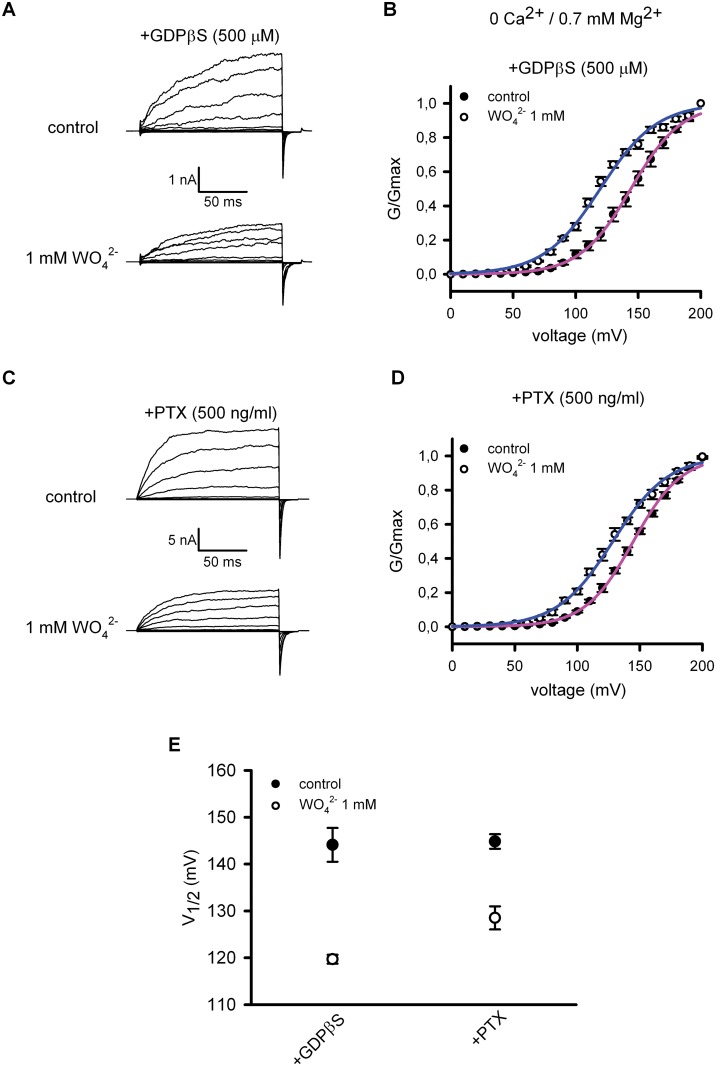
Fig 2. Tungstate-mediated activation of BKαβ1 channels is independent of G proteins.
Representative currents recorded from excised inside-out macropatches obtained from HEK293 cells expressing the BKαβ1 channels in the presence of 500 μM GDPβS (added to the bath solution) (A) or from transfected HEK293 cells pre-incubated with PTX (500 ng/ml, 24 hours) (C). Currents were recorded at cytosolic 0 Ca2+ and 0.7 mM Mg2+ before (control, top panels) and 5–10 minutes after cytosolic application of 1 mM tungstate (WO4 2-, bottom panel). The voltage protocol was as described in the Methods. (B), (D) Average G-V curves for BKαβ1 channels under the experimental conditions above mentioned. Solid curves were obtained by fitting the normalized conductance to the Boltzmann equation (see Methods). (E) Voltage for half maximal activation (V1/2 act) of BKαβ1 channels before (control, filled circles) and after addition of tungstate (1 mM WO4 2-, open circles) obtained for the indicated experimental conditions (+GDPβS, n = 4; +PTX, n = 6). No significant difference was found in the decrease on V1/2 act induced by tungstate when comparing both treatments: 24 ± 4 mV (n = 4) for GDPβS treatment versus 16 ± 3 mV (n = 6) for PTX treatment (P = 0.11, Mann-Whitney U-test). Besides the substantial difference in the duration of both treatments to inhibit G proteins (24–28 hours for PTX treatment and minutes for GDPβS treatment), no significant difference was found among them regarding V1/2 act before the addition of tungstate (control situation for GDPβS treatment: V1/2 act = 144 ± 4 mV (n = 4) versus control situation for PTX treatment: V1/2 act = 145 ± 2 mV (n = 6); P > 0.99, Mann-Whitney U-test). Furthermore, these V1/2 act control values (before tungstate application) were similar to the ones previously reported by us under identical experimental conditions but without interfering with the activation of G proteins: 139 ± 2 mV (n = 7) [14] and 147 ± 2 mV (n = 7) [26] (P = 0.1, ANOVA). Note that, as previously reported, 1 mM tungstate also reduced substantially the K+ current amplitude in the absence of cytosolic Ca2+ (A, C), an effect that, contrary to the tungstate-induced reduction of V1/2 act, has been shown to occur either in the absence or presence of Mg2+ and in the absence or presence of the different regulatory β subunits (β1-β4) [14]. For each experimental condition V1/2 act and kact values were (in mV): 144 ± 4 and 20 ± 0.3 (control situation for GDPβS treatment, n = 4); 120 ± 1 and 22 ± 1 (after WO4 2- addition for GDPβS treatment, n = 4); 145 ± 2 and 19 ± 0.3 (control situation for PTX, n = 6); 129 ± 2 and 21 ± 1 (after WO4 2- addition for PTX treatment, n = 6). No significant differences were found among kact values (P = 0.07, ANOVA).

