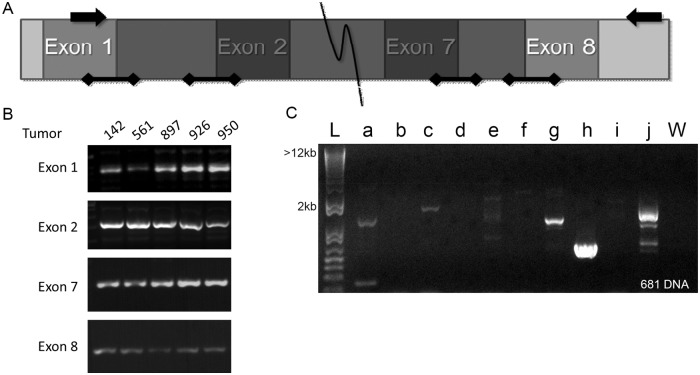
Fig 2. PCR amplification of EGFR for genomic alterations leading to EGFRvIII transcript.
A. Schematic of sequencing primers and areas of interest. Arrows indicate the location of the primers used to detect EGFRvIII in genomic DNA and unspliced RNA. Bars with diamond caps indicate areas amplified for splice donor and acceptor mutations. The shaded area is lost in EGFRvIII. B. Representative PCR amplification of the splice donor/acceptor sites of EGFR exons 1, 2, 7 and 8 in an EGFRvIII positive HNSCC DNA sample. These bands were excised and sequenced for mutations. C. Representative long-range PCR amplification of EGFR intron 1 for a single EGFRvIII positive HNSCC DNA sample. L: base pair marker, W: water control, a-j: primer sets.

