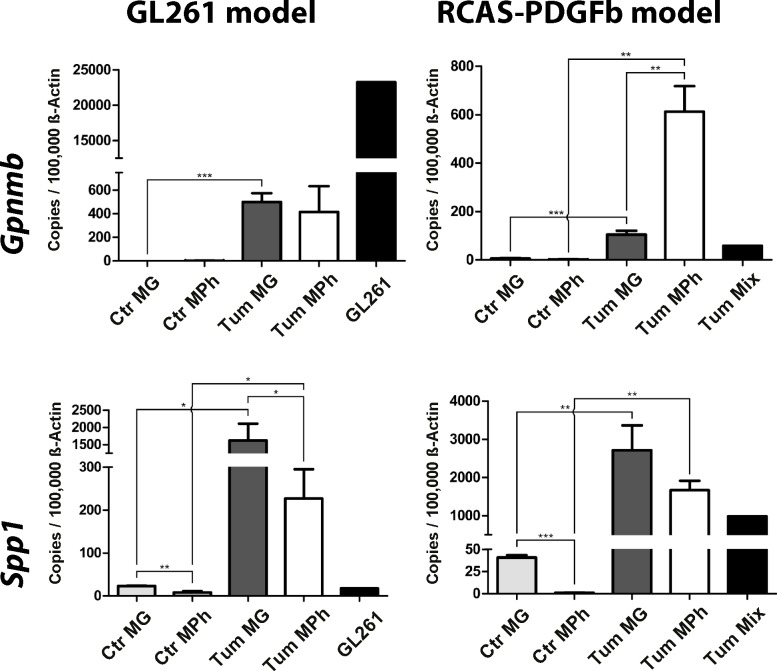
Fig 7. Gpnmb and Spp1 expression is upregulated in murine GAMs.
The gene expression of Gpnmb and Spp1 was validated using qRT-PCR. For this we used the same FACS-sorted samples from GL261 and RCAS tumors as in Fig. 5. The upregulation of both genes could be confirmed in both tumor models. Resident microglia and invading macrophages/monocytes show different expression patterns of these genes. CTR MG: naïve microglia, CTR Mph: naïve monocytes, Tum MG: glioma-associated microglia, Tum Mph: glioma-associated macrophages/monocytes, GL261: cultured GL261 cells, Tum Mix: cultured RCAS-PDGFb tumor cells. Bar graphs illustrate the absolute number of transcripts normalized to 100,000 transcripts of Actb (n = 4). Analysis was done by students t test. Error bars indicate the Standard Error of Mean (SEM). *, p<0.05; **, p<0.01; ***, p<0.001

