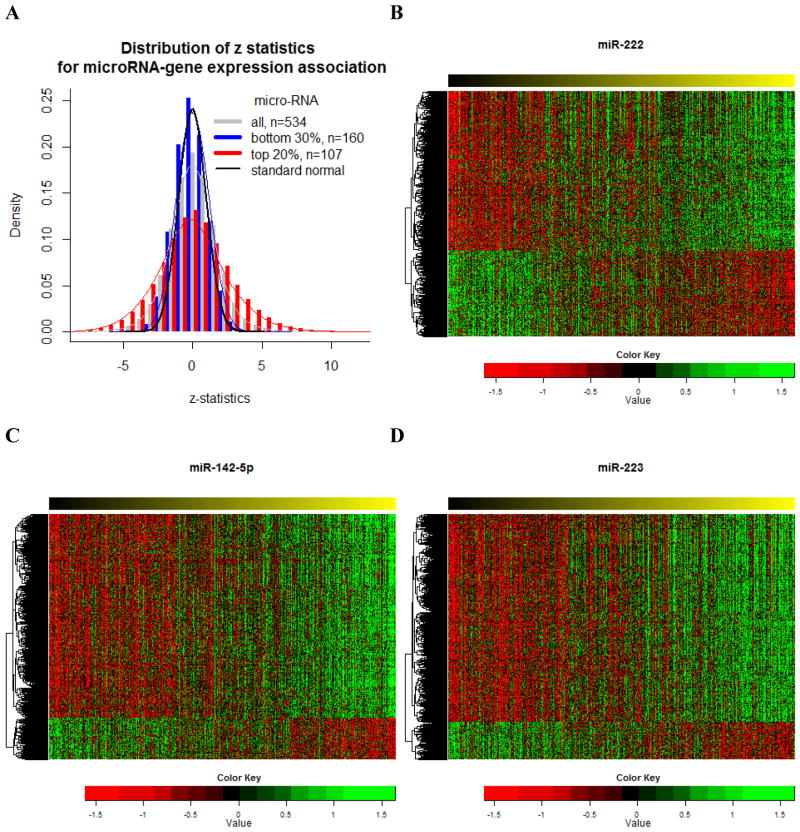
Figure 3. Genome-wide association of microRNA with gene expression in glioblastoma multiforme.
A, z-statistics of microRNA-gene expression association. B, Heatmap of the gene expression associated with miR-222. C, Heatmap of the gene expression associated with miR-142-5p. D, Heatmap of the gene expression associated with miR-223. The row is sorted by the value of microRNAs from low (left) to high (right)

