
Figure 1.
Underlying Causal Diagrams
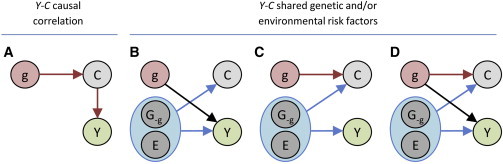
Four causal diagrams describing the causal relationship between the genotypes G, environment E, a covariate C, and the outcome of interest Y are shown. In (A), the correlation between Y and C is due to a direct effect of C on Y, whereas in (B)–(D,) the correlation between Y and C is explained by shared risk factors.