
Figure 2.
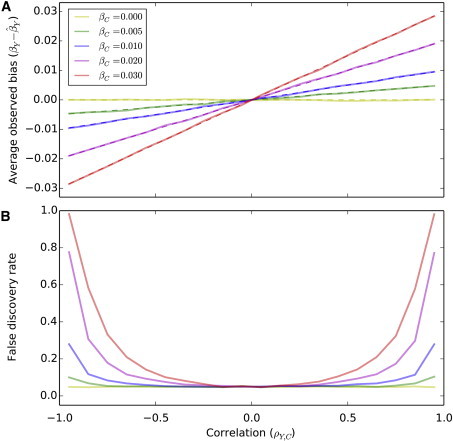
Effect Estimates and False Discovery Rate
Results for simulations of correlated outcomes and covariates and a genetic variant that influences the covariate only are shown. In (A), the average observed bias of the genetic effect estimate in the covariate adjusted analysis is plotted as a function of the correlation between the outcome and the covariate for different values of direct genetic effect on the covariate. The dashed lines correspond to the theoretical bias as derived in the method section. In (B), the average false discovery rate (α = 0.05) of over 5,000 replicates is plotted as a function of ρY,C the correlation between the outcome and the covariate for different values of direct genetic effect on the covariate when simulating 2,000 individuals.