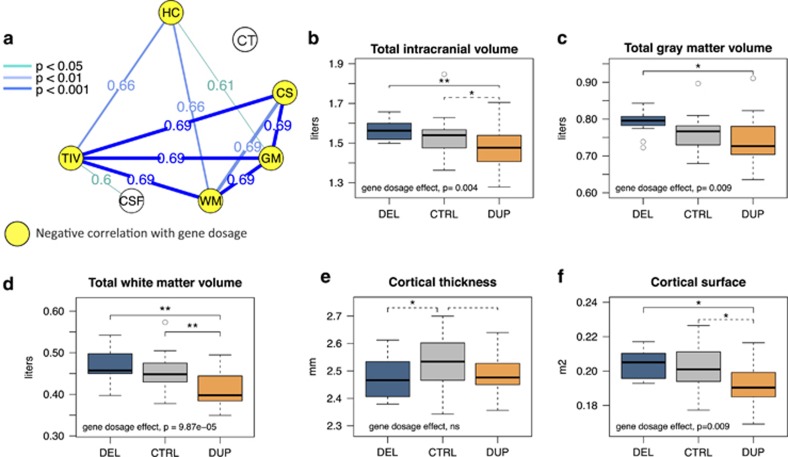
Figure 1.
Effects of gene dosage on global brain metrics. (a): Correlation between global brain metrics in 16p11.2 CNV carriers and controls. The intensity of blue lines represents positive r Pearson's coefficient correlations at different statistical thresholds. All global measures are inter-correlated except for CT and CSF. (b–f): Boxplots representing TIV, GM, WM volume, cortical surface area and cortical thickness adjusted for age and gender in deletion, duplication carriers and intrafamilial controls. **P⩽0.001; *P⩽0.05 uncorrected. Gene dosage effect is estimated in a linear regression analysis using the number of copies (1, 2 or 3), and including age, gender as covariates. Significant differences between groups after Bonferroni correction (threshold at P<0.01) are represented by solid black lines, trends—by dashed lines. HC, head circumference; TIV, total intracranial volume; GM, gray matter; WM, white matter; CSF, cerebrospinal fluid; CT, cortical thickness; CS, cortical surface area; DEL, deletion carriers; CTRL, intrafamilial controls; DUP, duplication carriers.

