Figure 4.
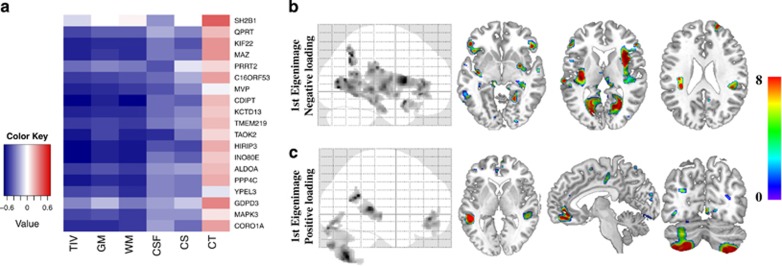
Effects of mRNA levels on global and local metrics of brain anatomy. Brain anatomy changes explained by mRNA levels of 18 genes within the 16p11.2 BP4-BP5 interval in a subset of 27 participants. (a) Matrix correlation between mRNA levels and global measures of brain volume. The color key represents the Pearson correlation coefficient. Most mRNA levels, except for SH2B1, PRRT2 and GDPD3 are correlated to TIV, GM and WM. There are no correlations with cortical thickness and CSF. Statistical P values for all correlations are detailed in Supplementary Table 7. (b-c) Eigenimages represent the statistical parametric maps resulting from singular value decomposition analysis. This method simultaneously determines the best combination in each dataset (gene expression and voxels) in order to explain maximum covariance between gene expression and local brain volume. Negative loading indicate that low mRNA levels are associated with increased GM volumes while positive loading represents the inverse effect. TIV, total intracranial volume; GM, gray matter; WM, white matter; CSF, cerebrospinal fluid; CS, cortical surface area; CT, cortical thickness.

