
Figure 5.
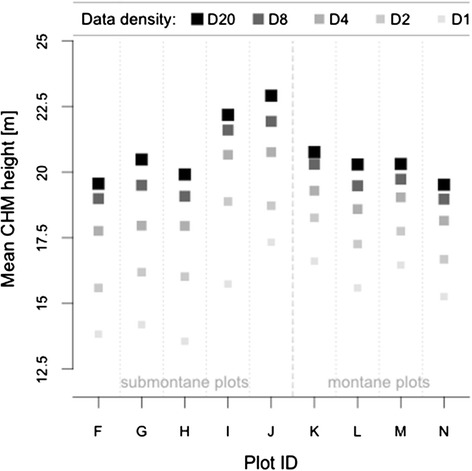
Mean canopy surface heights associated with the field plot locations (submontane Plots F - J and montane Plots K - L) based on CHMs generated from original and thinned lidar data (D20, D8, D4, D2 and D1 indicate the different data density levels).