
Figure 6.
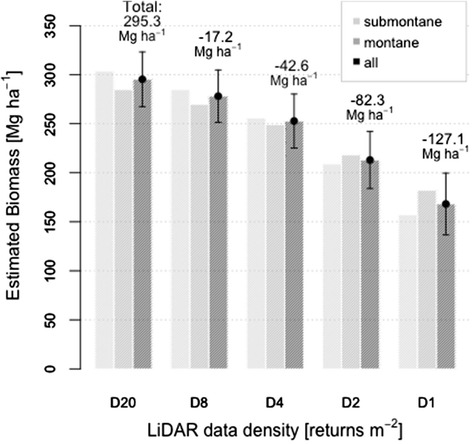
Aboveground biomass estimates in submontane and montane classes and across all nine permanent plots (mean ± standard deviation) for different data densities predicted with a linear model based on mean canopy surface height.
Official websites use .gov
A
.gov website belongs to an official
government organization in the United States.
Secure .gov websites use HTTPS
A lock (
) or https:// means you've safely
connected to the .gov website. Share sensitive
information only on official, secure websites.
Aboveground biomass estimates in submontane and montane classes and across all nine permanent plots (mean ± standard deviation) for different data densities predicted with a linear model based on mean canopy surface height.