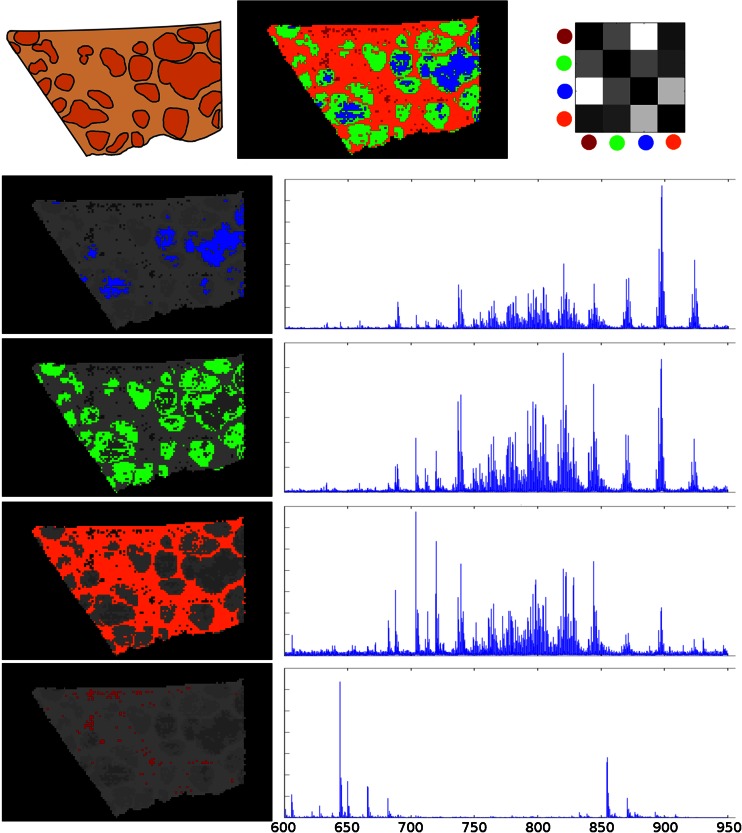
Figure 2.
Segmentation results using random projection for dimensionality reduction followed by k-means clustering. Top row (left to right): schematic of the image; the segmentation map with each cluster shown in a unique color; the cluster centroid distances illustrating relative cluster similarity (black - identical, white - greatest dissimilarity). Lower rows: the average spectrum from each segmented pixel region provides a molecular profile for the cluster

