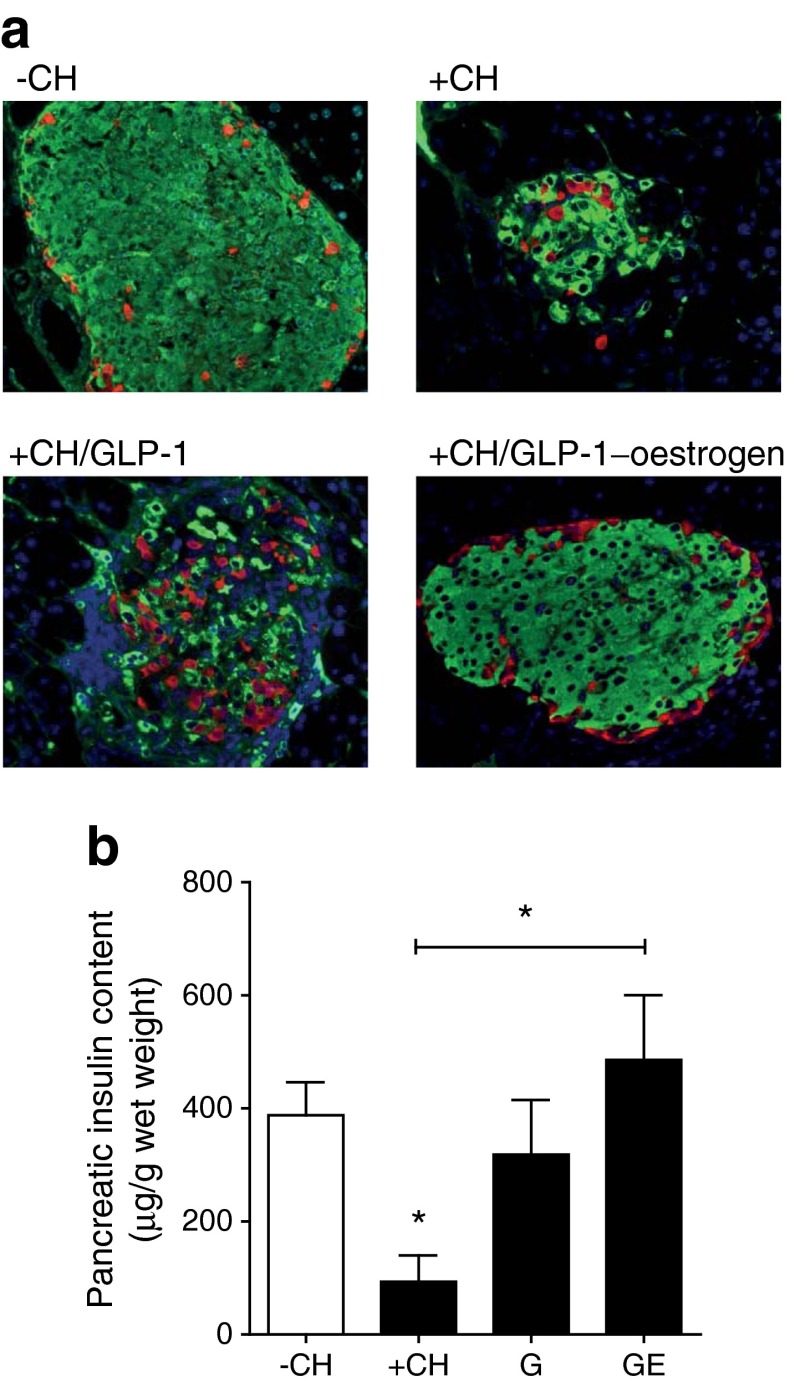
Fig. 2.
Pancreatic islet integrity. (a) Staining of pancreatic slices against insulin (green), glucagon (red) and nuclei (blue). (b) Pancreatic insulin content (n = 3 animals per group). All data are represented as means ± SEM. Differences compared with the −CH or +CH vehicle group (as indicated) were calculated by Student’s t test. *p < 0.05 vs −CH control and +CH control, respectively. G, GLP-1; GE, GLP-1–oestrogen

