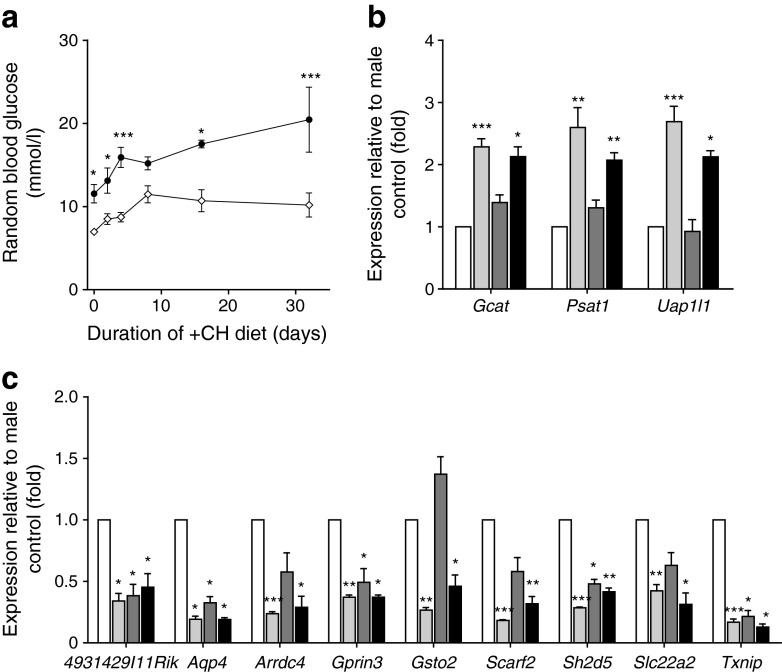
Fig. 7.
Gene expression in pancreatic islets 2 days after switch to +CH. (a) Blood glucose excursion in male vs female NZO mice upon switch to +CH diet. Genes being upregulated (b) and downregulated (c), respectively, in NZO females and GLP-1–oestrogen-treated males (n = 2–3 animals per group). Black circles, +CH males; white diamonds, +CH females. White bars, males; light grey bars, females; dark grey bars, males with GLP-1; black bars, males with GLP-1–oestrogen. Differences in blood glucose were calculated by two-way ANOVA. Expression differences were calculated by Student’s t test. *p < 0.05, **p < 0.01, ***p < 0.001 vs control

