
Figure 1.
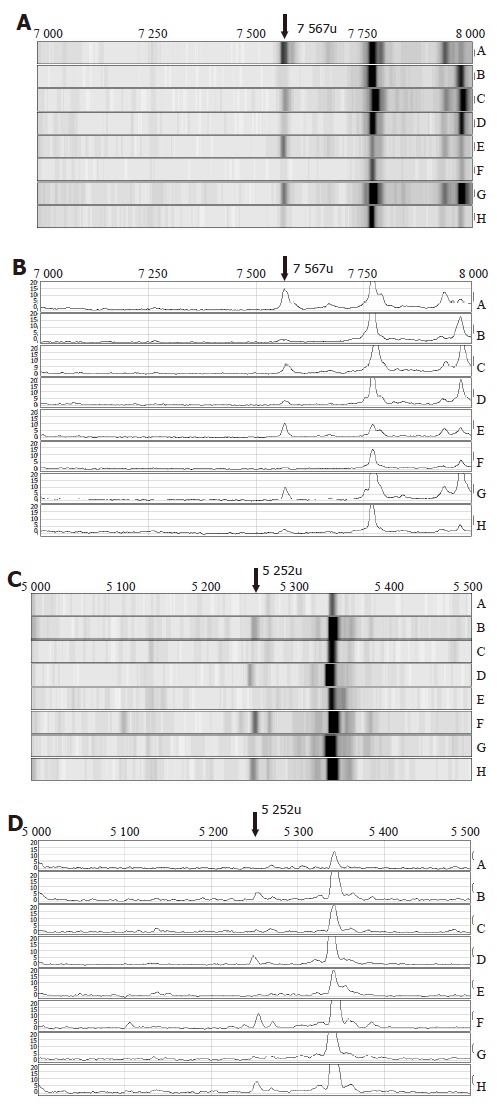
Detection of differentially expressed gastric cancer-associated serum proteins within a WCX2 chip. The arrows direct to the potential cancer markers detected in the mass spectra, 7 567 u (A, B) and 5 252 u (C, D), which were significantly different in gastric cancer samples compared with healthy controls. A, C, E and G were gastric cancer samples and the others were controls. A and C: A stacked trace view of candidate markers from diseased vs control individuals. B and D: A representative pseudogel view of SELDI-TOF-MS analysis of serum samples.