Figure 2.

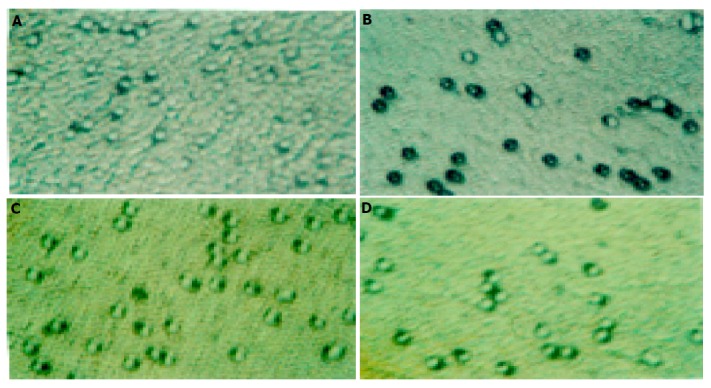
Invasion and migration of different groups of SL-174T cells (×200). A: Invasion of control group cells; B: 0.8 mmol/L L-NAME invasion group; C: migration of control group; D: 0.8 mmol/L L-NAME migration group.

Invasion and migration of different groups of SL-174T cells (×200). A: Invasion of control group cells; B: 0.8 mmol/L L-NAME invasion group; C: migration of control group; D: 0.8 mmol/L L-NAME migration group.