
Figure 5.
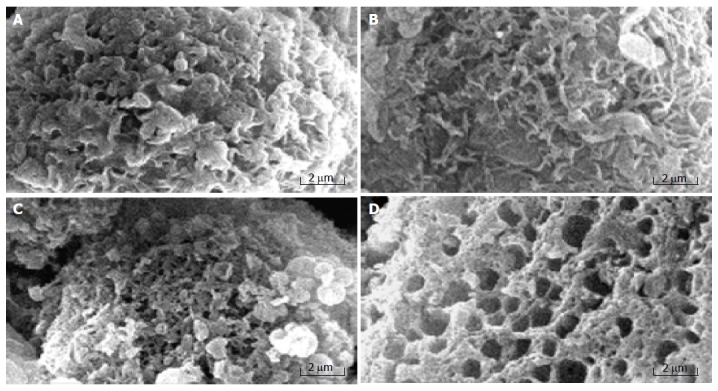
Surface morphology of control cells (A) and MGC803 cells treated with 100 μg/mL chitosan nanoparticles for 30 min (B), 2 h (C), and 4 h (D).
Official websites use .gov
A
.gov website belongs to an official
government organization in the United States.
Secure .gov websites use HTTPS
A lock (
) or https:// means you've safely
connected to the .gov website. Share sensitive
information only on official, secure websites.
Surface morphology of control cells (A) and MGC803 cells treated with 100 μg/mL chitosan nanoparticles for 30 min (B), 2 h (C), and 4 h (D).