
Figure 2.
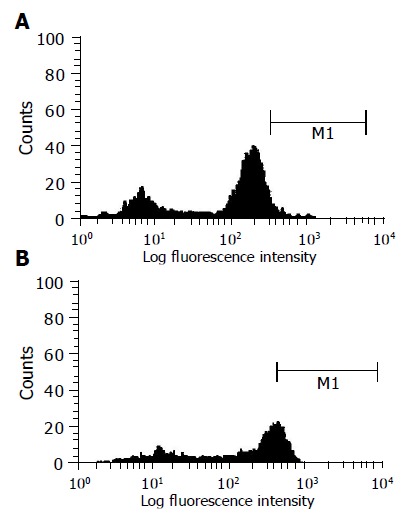
Histogram from gated leukocytes obtained from fluorescent activated cell sorter analysis of HCV-infected peripheral blood mononuclear leukocytes. Cells were stained intracellularly with anti-C2 antibody conjugated with FITC. Histogram represents gated leukocytes from (A) healthy uninfected cells or (B) infected cells stained with anti-C2 antibody conjugated with FITC after incubation of blood with serum sample after 24 h at 37 °C in which x-axis represents fluorescence intensity. M1 is marker for positive cell population.