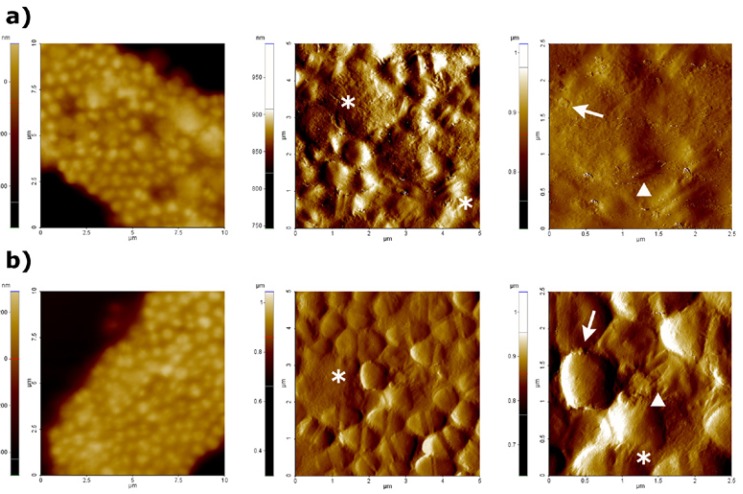
Figure 2.
AFM images obtained at a difference scan sizes (100 µm2, 25 µm2 and 6.25 µm2) after treatment with Diode laser at 1W (a) and 2W (b) of power. First column shows topography images, whereas amplitude images are shown in second and third column. Stretch marks or lose of typical cell morphology are represented by asterisks, blebs are represented by arrows, and shape perturbations are represented by triangles.

