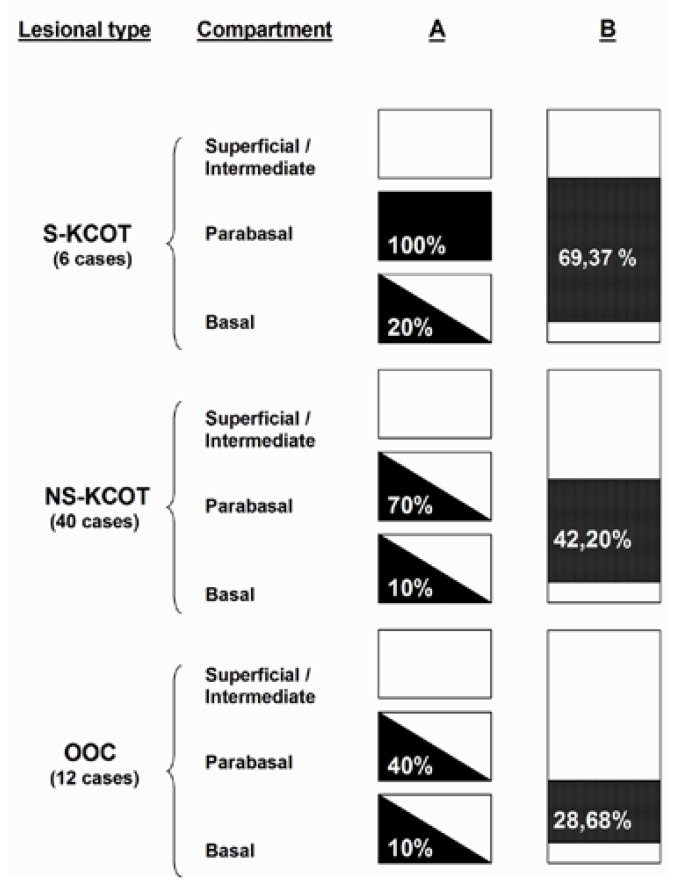
Figure 3.
Schematic representation of CCD 1 expression by lesional types. In column A, epithelial thickness is divided into three compartments represented by boxes. CCD1 expression is represented by a 3-grade evaluation: the black shading represents that the expression was observed in virtually all the cells of compartment. The white shading represents that the expresión was almost completely negative in all compartment. The diagonal represents that the expression is partially positive in the compartment, the number indicate porcentage of CCD1+ cells. Column B represents total epithelial thickness, black shading indicates the porcentual thickness of epithelium CCD1+ and the level at which is located, the number indicate porcentage of thickness with CCD1+ immunostaining.

