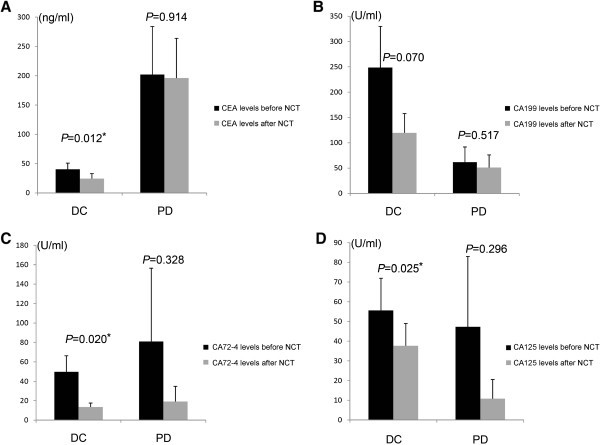
Figure 3.

Mean levels of four tumor markers before and after neoadjuvant chemotherapy in disease control (CR + PR + SD) and PD (disease progression) group respectively. A. C. D shows CEA, CA724, and CA125 decreased more significantly in the disease control (CR + PR + SD) group than the disease progression (PD) group (P = 0.012, P = 0.020, and P = 0.025, respectively). B. show the decreased levels of CA199 was not statistically significant (P values was 0.849).
