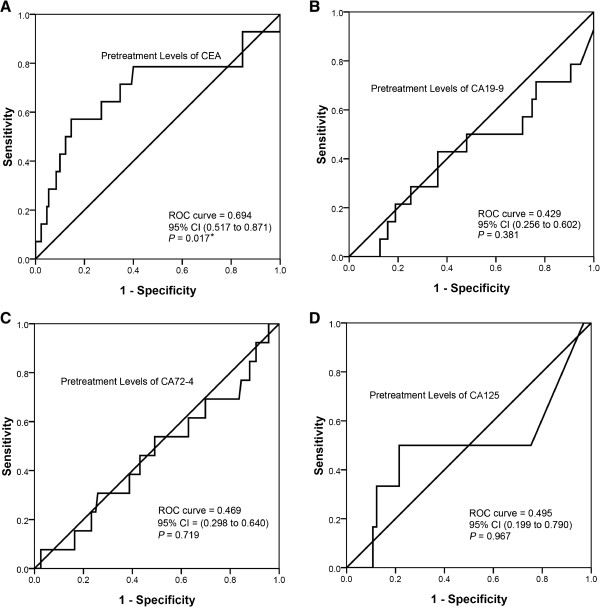
Figure 5.

ROC curves for pretreatment levels of tumor markers to predict the disease progression after neoadjuvant chemotherapy. A. The area under the ROC curve of CEA pretreatment levels was 0.694 (95% CI: 0.517 to 0.871, P = 0.017); the cutoff that maximized both sensitivity (57.1%) and specificity (85.4%) of this test was 50 ng/ml. The correlation coefficient between CEA pretreatment levels and pathologic response was 0.199, and the P value was 0.017. B.C.D show the pretreatment levels of CA72-4, CA199, and CA125 were not statistically significant (P values were 0.381, 0.719, and 0.967 respectively).
