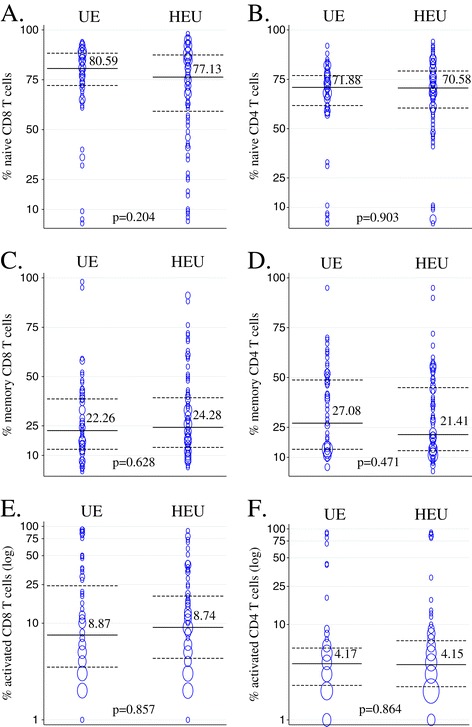
Figure 1.

Distribution of T-cell populations among HIV-exposed infected (HEU) and unexposed (UE) infants at 1 month of age. Medians for data from HEU (n = 74) and UE (n = 56) are indicated and plotted in solid lines with dotted lines representing interquartile ranges. The size of bubbles is proportional to number of observations. A, C, and E show naïve, memory and activated CD8 T-cell populations and B, D and F show naïve, memory and activated CD4 T-cell populations.
