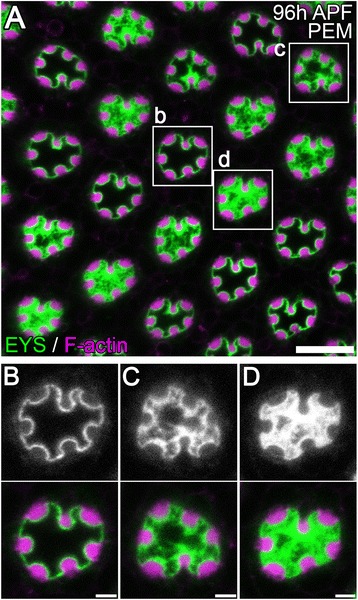
Figure 3.

The dilated IRS shows various degree of loss of central EYS immunofluorescence. (A–D) Immunofluorescence micrographs of 96 h APF w 1118 Drosophila ommatidium fixed in PEM. The rhabdomeres, F-actin, are labeled with phalloidin (magenta) and EYS staining is shown in green. (A) Low magnification view. (B–D) Enlarged view of areas indicated in (A). Scale bar, (A) 10 μm; (B–D) 2 μm.
