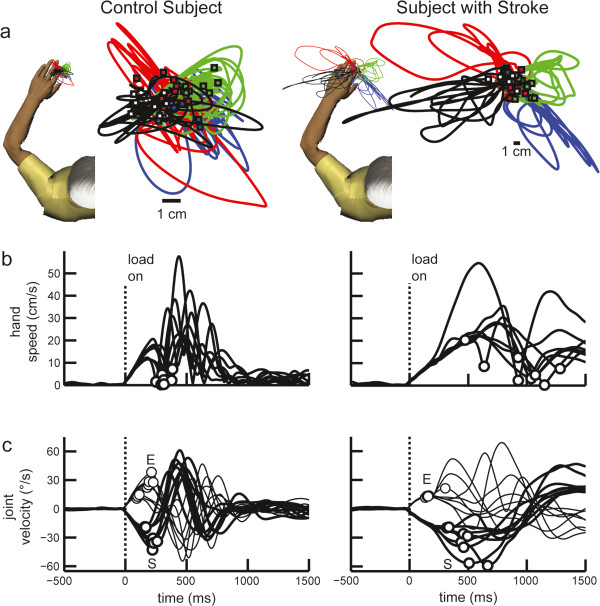
Figure 2.

Performance of exemplar subjects in postural perturbation task. Left panel: Control subject. (a) Hand paths with left arm. Trials responding to an elbow flexion, elbow extension, shoulder flexion, and shoulder extension perturbation are shown in blue, red, green, and black, respectively. Square markers show endpoint positions. (b) Subject hand speed. Circles are first hand speed minima. (c) Subject elbow (thin line) and shoulder (thick line) velocity. First peaks are represented by circle markers, labelled ‘E’ and ‘S’ respectively. Right panel: Subject with stroke. (a) Hand path with left affected arm. Note that subject hand paths are on different scales between panels. (b) Hand speed for subject with stroke. (c) Joint velocity for subject with stroke.
