
Figure 4.
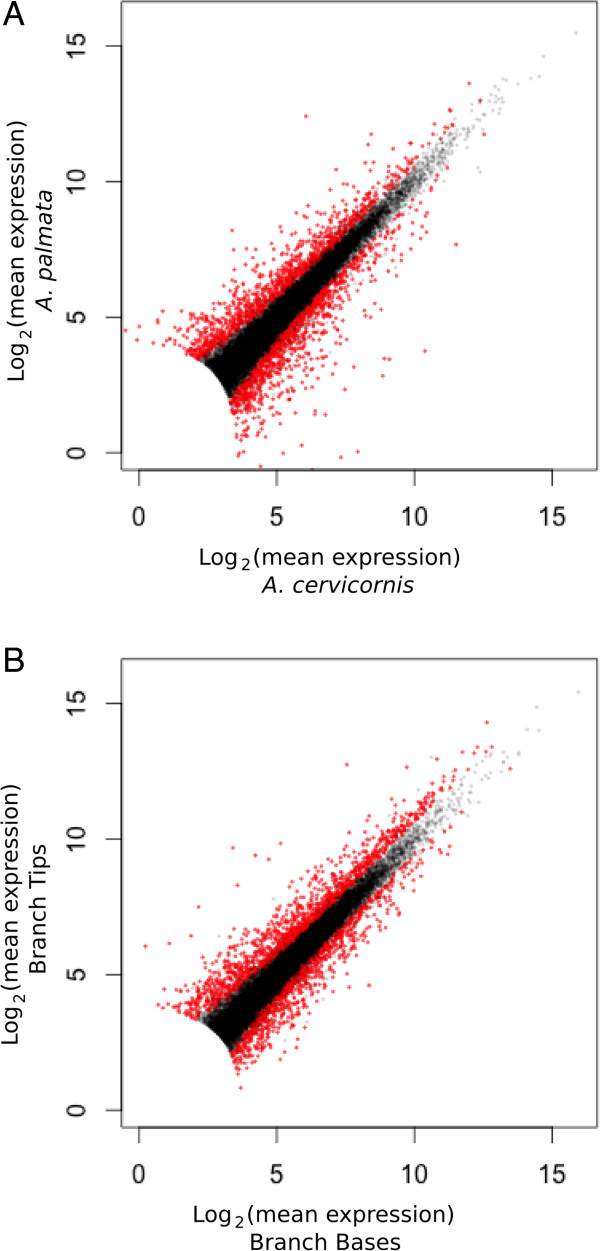
Scatter plots of gene expression for all genes in the dataset (n = 22,320). Species (A) and colony position (B) comparisons with DE transcripts in red (Padj < 0.05). Filtering of transcripts expressed at < 100 total normalized counts results in the loss of points around the origin.