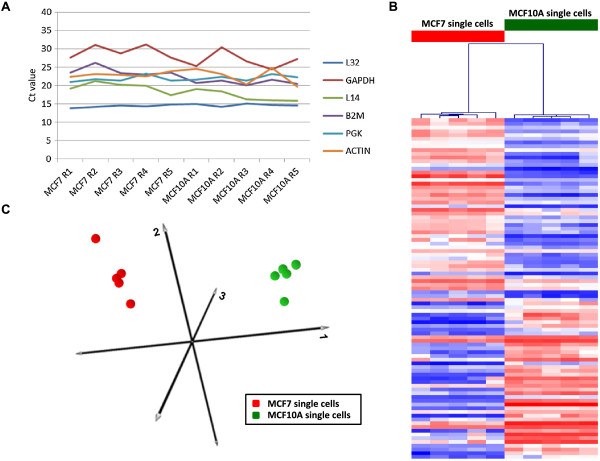
Figure 2.

Transcriptional profiling of RNA-Amplified MCF7 and MCF10A single cells. (A) Real-time PCR of RNA-Amp™ samples showing sensitive and consistent detection of 6 “housekeeping genes” in all single cell samples. (B) A heat map presentation of differentially expressed genes (LIMMA FC > 2, FDR < 0.01) detected in the Affymetrix array data from the group of 10 single cell MCF7 and MCF10A samples with blue indicating the lowest detected, red indicating the highest detected and white the midpoint. (C) PCA plot generated from the entire single cell Affymetrix array data set showing separation of all MCF7 and MCF10A samples.
