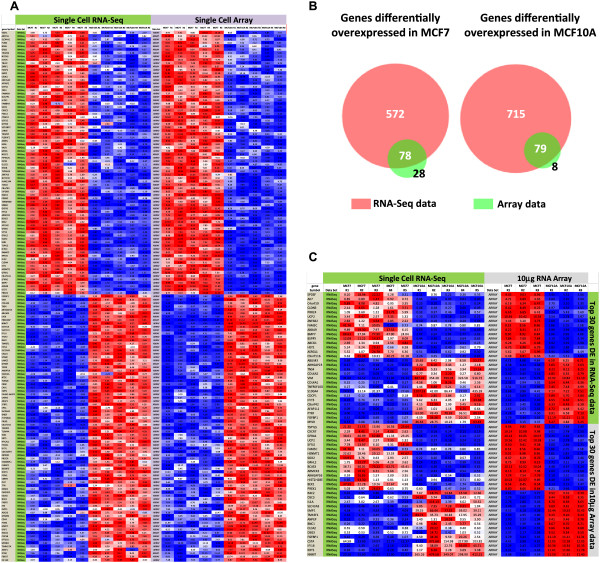
Figure 4.

Comparison of RNA-Seq and Microarray data from single cells. (A) A comparison of RNA-Seq and Affymetrix array data generated from the same amplified single cell samples. The overall correlation (Pearson) of the MCF7/MCF10A ratio between RNA-Seq and Affymetrix array data sets for the 157 genes examined was 0.95. (B) Venn diagrams showing overlaps of differentially expressed genes identified by RNA-Seq and Affymetrix array analysis (FC > 2, FDR < 0.05 for both data sets) highlighting the larger number of DE genes identified in the RNA-Seq data set. (C) A comparison of single cell RNA-Seq data and10 μg RNA Affymetrix array data showing the expression profiles of the top 30 differentially expressed genes identified by RNA-Seq or 10 μg RNA Affymetrix array data (all data FC > 2, FDR threshold 0.05). Heat map colour scheme for (A) and (C) as described in Figure 2B.
