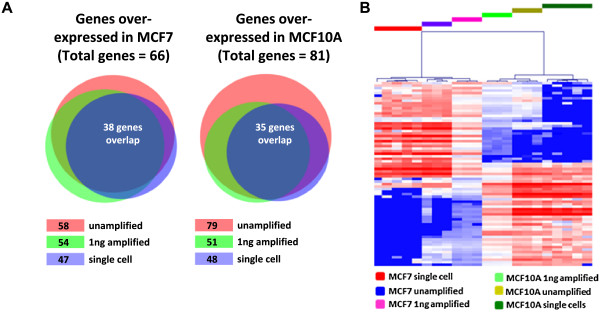
Figure 5.

High-density real-time PCR analysis of differentially expressed gene signatures. (A) Venn diagrams showing the overlap of differentially expressed MCF7/MCF10A genes detected by high density qPCR of: unamplified cDNA from 1 μg RNA; RNA-Amp™ cDNA from 1 ng RNA; and RNA-Amp™ cDNA generated from single cells. Numbers in boxes represent the number of genes upregulated in that template type. (B) Bioinformatic analysis of the real-time PCR data identified 73 genes differentially expressed between MCF7 and MCF10A across all template types (LIMMA FC > 2, FDR < 0.01) and hierarchical clustering clearly separated the two cell lines. Heat map colour scheme for (B) as described in Figure 2B.
