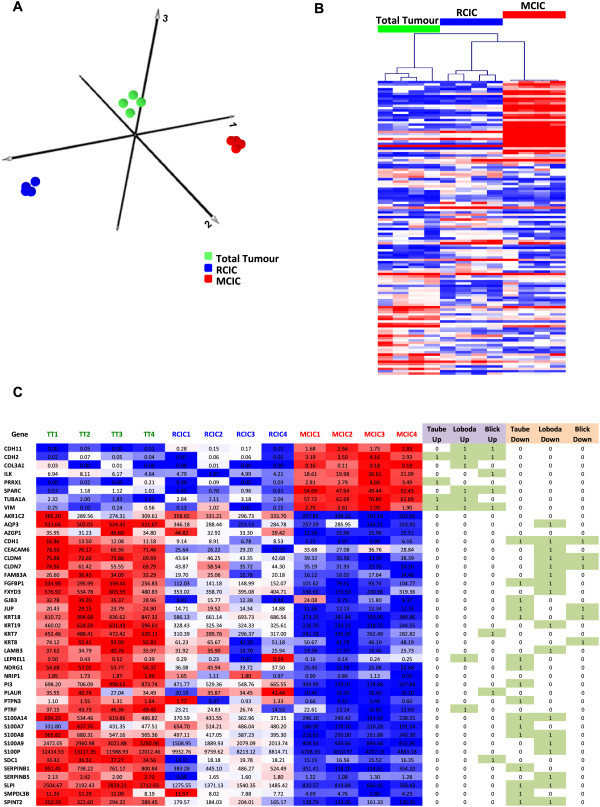
Figure 6.

Transcriptional profiling of fractionated NSCLC-PDX subpopulations. (A) PCA analysis of total RNA-Seq data from NSCLC-PDX fractionated samples showed clear separation of the metastasis associated cancer initiating cells (MCIC) and resident cancer initiating cells (RCIC) from unfractionated total tumour (TT). (B) Heat map of hierarchical clustering of top differentially expressed genes (50 TT v RCIC, TT v MCIC, RCIC v MCIC, EdgeR FC > 2, FDR < 0.05) illustrates clear separation of the three populations and a set of genes with the most striking change seen between TT and MCIC samples. Heat map colour scheme for (B) as described in Figure 2B. (C) Summary of EMT signature genes found to be differentially expressed (FC > 2, p < 0.05) in NSCLC-PDX fractionated samples with correlation between differentially expressed genes identified in MCIC and three published EMT signatures highlighted (boxed green). Column headings are: MCIC - metastasis associated cancer initiating cells; RCIC- resident cancer initiating cells; TT - unfractionated total tumour (TT); Taube et al. - EMT genes identified by Taube and colleagues [27]; Loboda et al. – EMT genes identified by Loboda and colleagues [21]; Blick et al. - EMT genes identified by Blick and colleagues [22].
