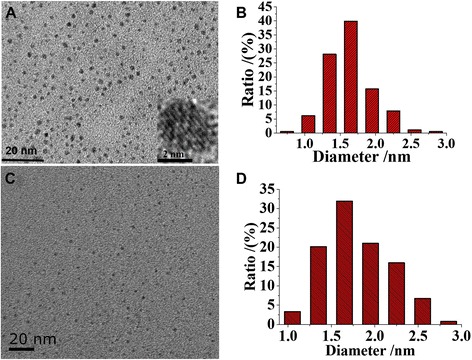
Figure 2.

Transmission Electron Microscope (TEM) images. (A) Typical image of Au NCs. (C) Typical image of Au/Ce NCs. Inset in image (A): high resolution image with the crystallinity of the metallic structure. (B) The size distribution histogram of Au NCs. (D) The size distribution histogram of Au/Ce NCs.
