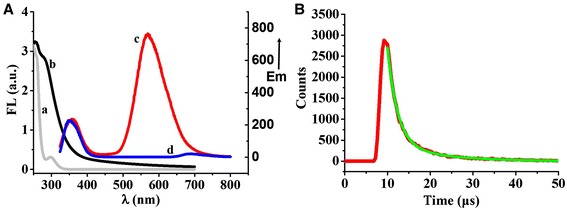
Figure 4.

Optical characterization of Au/Ce NCs. (A) UV–Vis absorption spectroscopy and fluorescence emission spectrum: Curve a and curve b were UV–Vis absorption spectroscopy of Ce3+ aqueous solution and Au/Ce NCs, respectively. Curve c and curve d were fluorescence emission spectrum of Au/Ce NCs and Ce3+ aqueous solution, respectively, excitation wavelength was 290 nm. (B) Fluorescence lifetime analysis of Au/Ce NCs, excitation was 430 nm.
