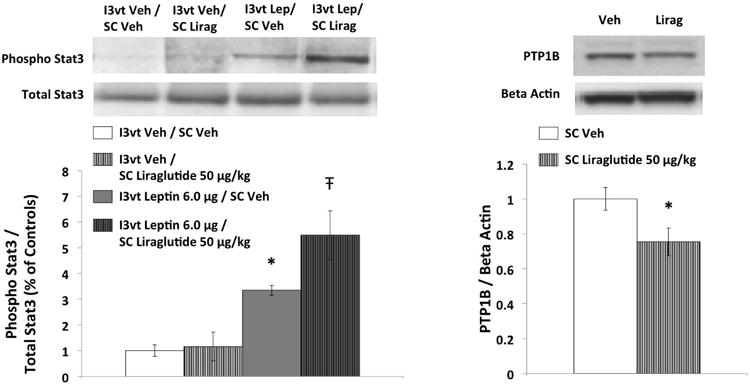
Figure 5.

Phosphorylated STAT3 (pSTAT3) protein levels in hypothalamic tissue following I3vt leptin (6μg) and SC liraglutide (50μg/kg); and hypothalamic PTP1B protein following SC liraglutide (50μg/kg). Leptin alone significantly increased pSTAT3 levels. Hypothalamic pSTAT3 was further increased with co-administration of liraglutide and leptin. Liraglutide alone reduced PTP1B levels in the hypothalamus. Upper panel: representative immunoblots of pSTAT3, STAT3, PTP1B and beta actin. Lower panel: quantitative densitometric data of pSTAT3 normalized to total STAT3 (n=6-7 per group), and PTP1B normalized to beta actin (n=9 per group). * P<0.05 vs Vehicle, Ŧ P<0.05 vs all other treatments (I3vt Veh/SC Veh, I3vt Veh/SC Liraglutide, I3vt Leptin/SC Veh).
