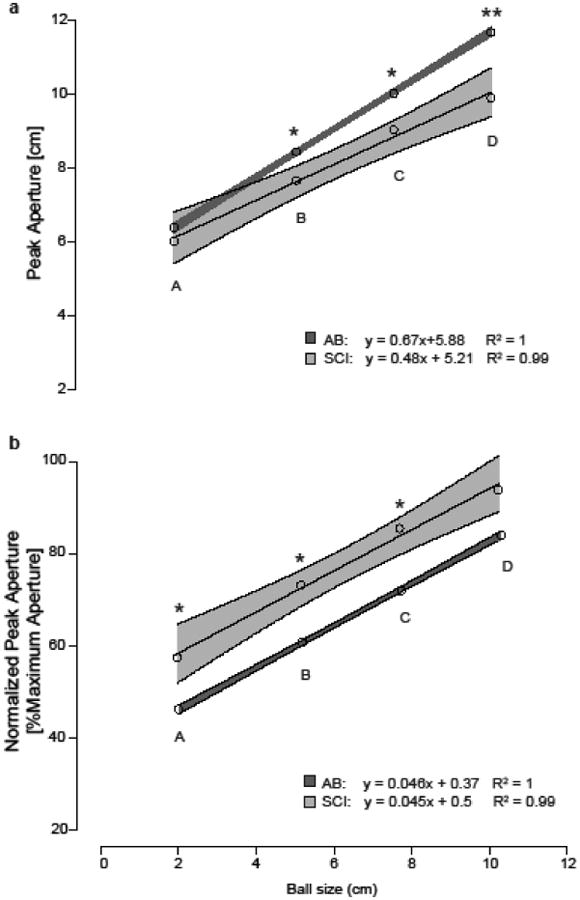
Figure 3. Aperture modulation with ball size is preserved within the limits of available aperture range.

Linear regression models were used to describe the relationship between mean peak aperture during reach and ball size for AB and SCI groups. Light grey corresponds to the SCI group and dark grey to the AB group; means are represented as circles and shaded area represents 95% confidence intervals (CIs). Significant differences in peak aperture for a given ball size are indicated by an asterisk (p<0.05) or double asterisk (p<0.01). (a) AB control group show a steeper increase in absolute peak hand aperture across ball size compared to the SCI group. There iss no significant difference in mean peak aperture for the smallest ball size (A), but peak aperture differed significantly for balls B, C, and D. (b) When normalized to overall maximum aperture, the SCI group show similar slope and aperture modulation to AB group, with the SCI group using a greater percentage of their aperture range.
