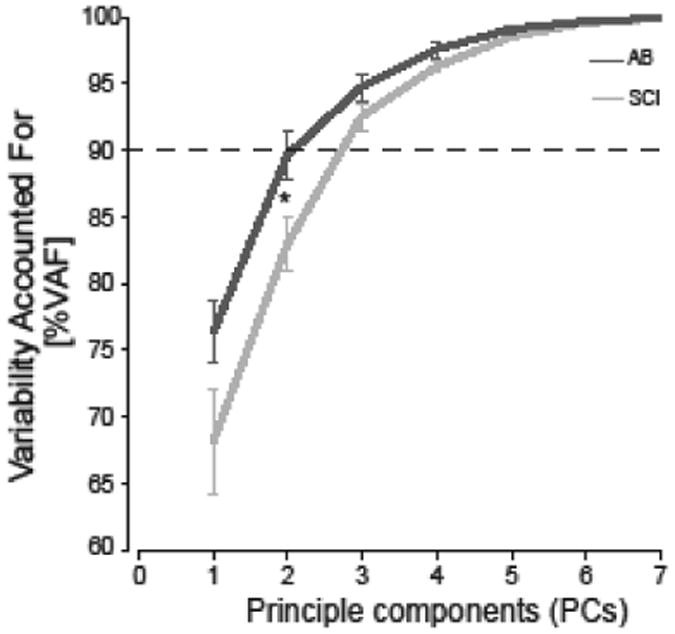
Figure 6. Similar number of coordination patterns between AB and SCI groups.

Coordination patterns were estimated using principle component analysis/independent component analysis (ICA/PCA) on the EMG data for the SCI and AB groups. Horizontal dashed line depicts 90% variance accounted for of the observed muscle activity. An asterisk indicates statistical significant differences between groups (p<0.05).
